Competitive 9% Housing Tax Credit · Application #26156
Hudson Hallmark Apartments
72 units of new-construction family housing in Brownsville, Texas, developed by STH Development with tax credit equity from Advantage Capital and debt from Citi Bank.
Competitive 9% Housing Tax Credit · Application #26156
72 units of new-construction family housing in Brownsville, Texas, developed by STH Development with tax credit equity from Advantage Capital and debt from Citi Bank.
The development
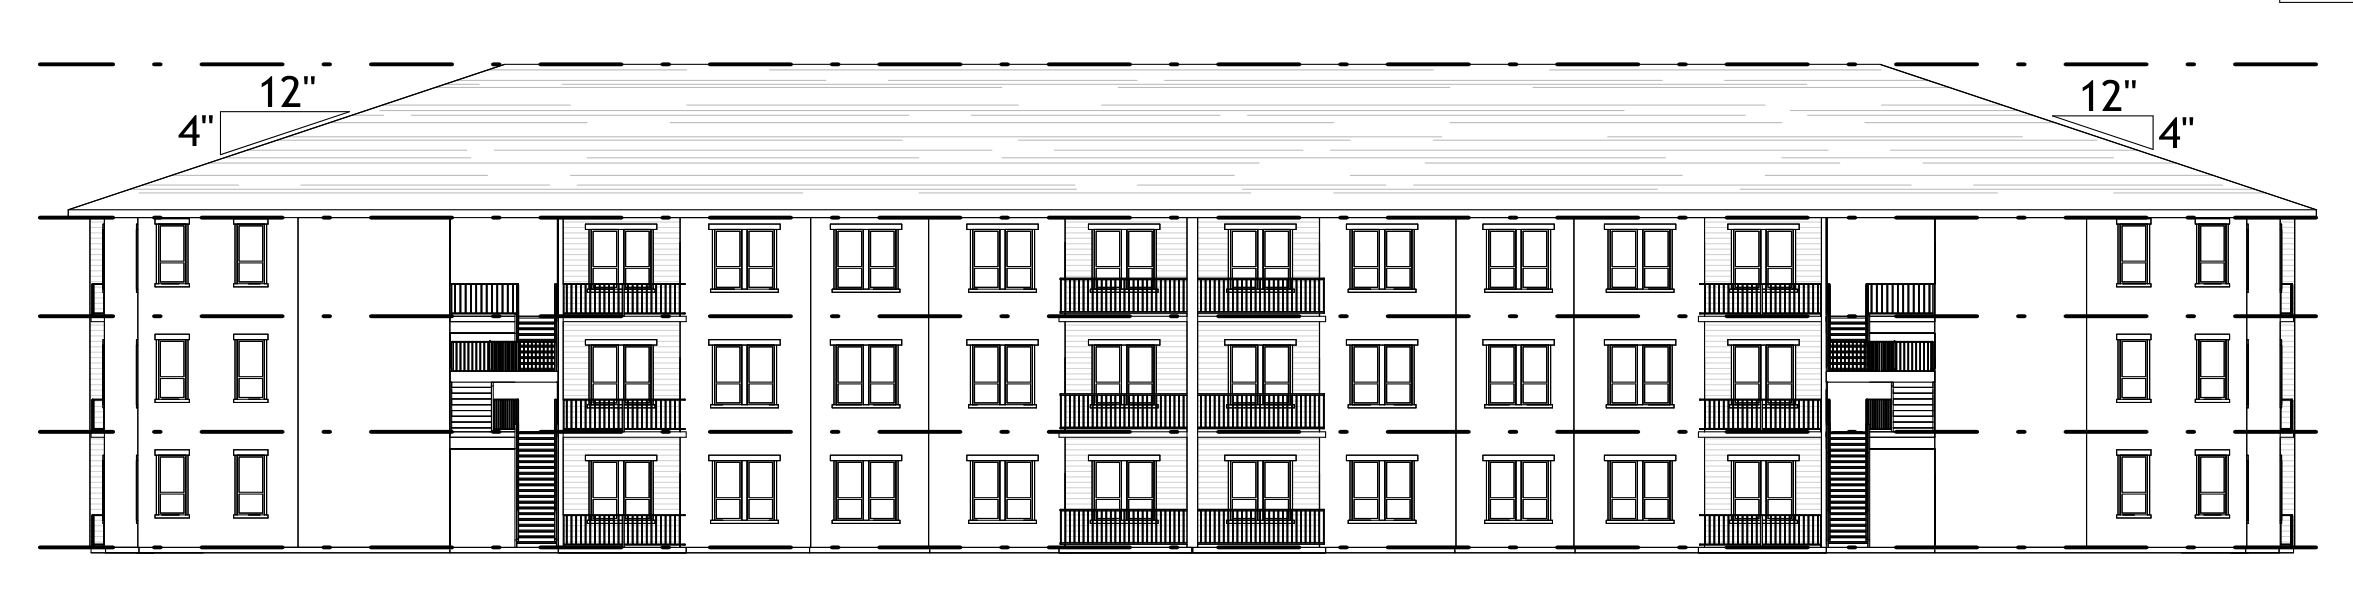
Hudson Hallmark is a 72-unit, new-construction affordable housing community for families at the northeast corner of Ruben M. Torres Boulevard and Hudson Boulevard in Brownsville, Cameron County. It will serve the general population across two three-storey garden buildings of 36 units each, on a four-acre development site.
TDHCA's Real Estate Analysis Division completed its underwriting on 6 August 2026 and recommended the full $2,000,000 annual credit the applicant requested — $27,778 per unit. The analysis identified one strength, a low 3.0% gross capture rate, and two risks: a 1.15 debt coverage ratio and the site's location in flood zone AH.
Affordability is layered across four income bands: 11% of units at 30% of area median income, 40% at 50%, 38% at 60% and 11% at 80% — a 55% average. Underwritten rents average $888 against market rents of $1,433 for comparable units, a 38% discount that underpins the demand case.
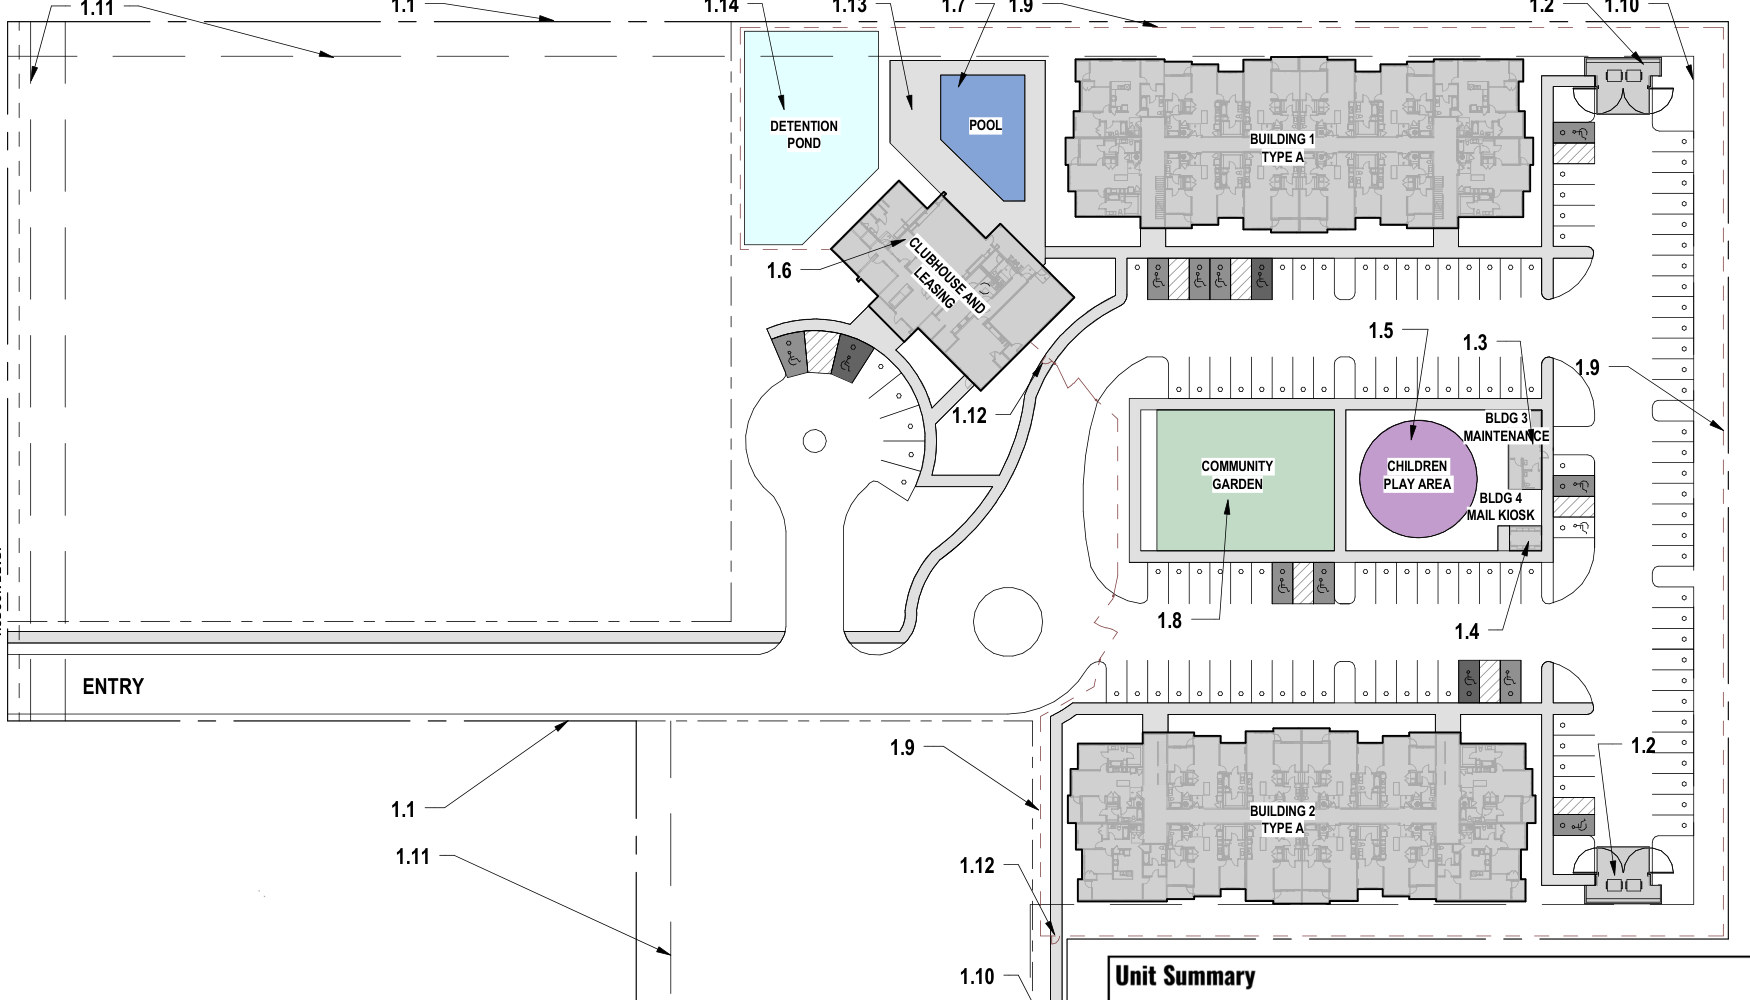
The community includes a 4,848 sq. ft. clubhouse with fitness, yoga and community rooms, a pool, a community garden, a children's play area and a perimeter walking trail. Ruben M. Torres Boulevard is a primary arterial, putting the site within reach of schools, employers, retail and healthcare across Brownsville and the wider Rio Grande Valley.
$2,000,000 annual 9% federal housing tax credit, as requested
TDHCA Real Estate Analysis Division · 6 August 2026 · New Application — Initial UnderwritingSource: TDHCA REA underwriting report, 6 August 2026, and the able.city concept package.
Unit mix & rents
Every unit is income-restricted. Rents shown are net of the tenant-paid utility allowance — the rents actually collected. TDHCA accepted the rent schedule without adjustment.
| Plan | Size | AMI | Units | Program limit | Utility allow. | Net rent | Market rent | Monthly total |
|---|---|---|---|---|---|---|---|---|
| Unit A1 1 bed / 1 bath · 24 units | 760 sf +70 sf balcony | 30% | 3 | $447 | $49 | $398 | $1,200 | $1,194 |
| 50% | 10 | $745 | $49 | $696 | $6,960 | |||
| 60% | 8 | $894 | $49 | $845 | $6,760 | |||
| 80% | 3 | $1,192 | $49 | $1,143 | $3,429 | |||
| Unit B1 2 bed / 2 bath · 36 units | 997 sf +66 sf balcony | 30% | 4 | $536 | $66 | $470 | $1,500 | $1,880 |
| 50% | 14 | $893 | $66 | $827 | $11,578 | |||
| 60% | 14 | $1,072 | $66 | $1,006 | $14,084 | |||
| 80% | 4 | $1,430 | $66 | $1,364 | $5,456 | |||
| Unit C1 3 bed / 2 bath · 12 units | 1,116 sf +56 sf balcony | 30% | 1 | $619 | $83 | $536 | $1,700 | $536 |
| 50% | 5 | $1,032 | $83 | $949 | $4,745 | |||
| 60% | 5 | $1,239 | $83 | $1,156 | $5,780 | |||
| 80% | 1 | $1,652 | $83 | $1,569 | $1,569 | |||
| Total | 67,524 sf | 55% | 72 | $888 | $1,433 | $63,971 |
| Band | Units | Share | |
|---|---|---|---|
| 30% of area median income | 8 | 11.1% | |
| 50% of area median income | 29 | 40.3% | |
| 60% of area median income | 27 | 37.5% | |
| 80% of area median income | 8 | 11.1% | |
| Blended average | 72 | 55% |
Underwritten rents average $888 against $1,433 for comparable market-rate units — a 38% discount. That gap is what makes the demand case, and it is why the analyst expects the property to lease at 16 units a month.
Source: REA underwriting report, unit mix / monthly rent schedule. Area median income $66,500, program rent year 2025.
Risk profile
The underwriting report states one strength and two risks. Both are reproduced here rather than summarised away, along with the insurance sensitivity that sits behind the coverage ratio.
3.0% against a 10% maximum — the development needs three of every hundred income-qualified households in the market area.
Underwritten rents average $888 against $1,433 for comparable market-rate units, a 38% discount.
The 19 stabilised affordable developments in the primary market area average 98.3% occupancy.
The minimum TDHCA will underwrite. There is little cushion between net operating income and debt service in year one.
The site sits in FEMA zone AH (elevation 20) and zone X per panel 48061C0580F. Finished ground-floor elevations must be built at least one foot above the floodplain, drives and parking no more than six inches below, and flood insurance must remain in force.
TDHCA underwrote property insurance at $807 per unit from a non-bindable indication. Brownsville comparables average $1,266 per unit — a level at which the deal would be infeasible. TDHCA confirmed with the provider that the discount reflects the developer's multi-property relationship. At $847 per unit, coverage falls below 1.15x.
Source: REA underwriting report — risk profile and conditions.
Amenities
Resident amenities sit at the centre of the plan, between the two residential buildings and the pool.
Pool and decking adjacent to the clubhouse
385 sq. ft. fitness room plus a 270 sq. ft. yoga studio
381 sq. ft. with an adjoining 304 sq. ft. warming kitchen
190 sq. ft. centre plus two private work pods
498 sq. ft. multipurpose space
Dedicated resident garden plots
Fenced playground at the centre of the site
Perimeter trail within a fully fenced site
Covered pavilion with grills
Full perimeter fence with pedestrian gates
Site & location
GIBCO Environmental performed a Phase I Environmental Site Assessment to ASTM E1527-21 and 40 CFR Part 312, dated 15 March 2026. It revealed no recognised environmental conditions, no historical or controlled RECs, and no de minimis conditions, and recommended no further investigation. TDHCA's review separately noted two items carried into its conditions: the site's position in the 100-year floodplain, and a noise study required under HUD noise assessment guidelines.
Market
“The Brownsville affordable rental housing market is tight. In our professional opinion, the proposed development is feasible from a market perspective and a market exists for the development as proposed. If the complex were in service today, it would be full with a waiting list.”
Gibson Consulting, LLC · Jim Howell, Senior Analyst · Effective 14 March 2026 · demand figures as underwritten by TDHCA| Milestone | Units leased | Occupancy | |
|---|---|---|---|
| At construction completion | 20 | 28% | |
| 30 days post-completion | 36 | 50% | |
| 60 days post-completion | 52 | 72% | |
| 90 days post-completion | 68 | 94% | |
| 120 days post-completion | 72 | 100% |
Breakeven occupancy of 87.4% is reached within 120 days of construction completion, with 20 units pre-leased at delivery.
The analyst surveyed competing properties across the primary market area and reported turnover of one to fourteen days, with most units re-let before they were ready. TDHCA's own demand build and the capture rate by income band are set out in the financials.
Source: REA underwriting report, market analysis; Gibson Consulting market study, exhibit 37.
Development team
Shane Lynch
STH Development, LLC
development@STHDevelopment.com
817-881-3295
Wallace Reed V
Cinco Development
wallace.reed@cinco-dev.com
956-454-4314
The capital stack, development budget, credit calculation and the long-term pro forma — together with the REA underwriting report itself — sit behind a password. Use the one supplied with your link.